DataDock
DataDock is an application for creating customizable monitors, analysis tools, and bots. By exposing various modular blockchain analysis tools that are both ready out of the box and deeply specializable, you can use granular blockchain data to automate any task that you need!
Project Description
DataDock is an application for creating customizable monitors, analysis tools, and bots. By exposing various, modular, blockchain analysis tools ready out of the box yet deeply specializable. Use granular blockchain data to automate any task that you need!
Datadock is meant to be run inside of a Docker container. This allows for easy integrations like:
- Embedding into an existing API for enterprise uses
- Building a lightweight server for your web app
- Creating uniform dispute logic to bring historical data on chain with an optimistic oracle
- Automated alerts for your Discord server
- Running your own private automated arbitrage bot on your laptop
How it's Made
Data Sources
DataDock uses Streamingfast Substreams and Messari Standardized Subgraphs.
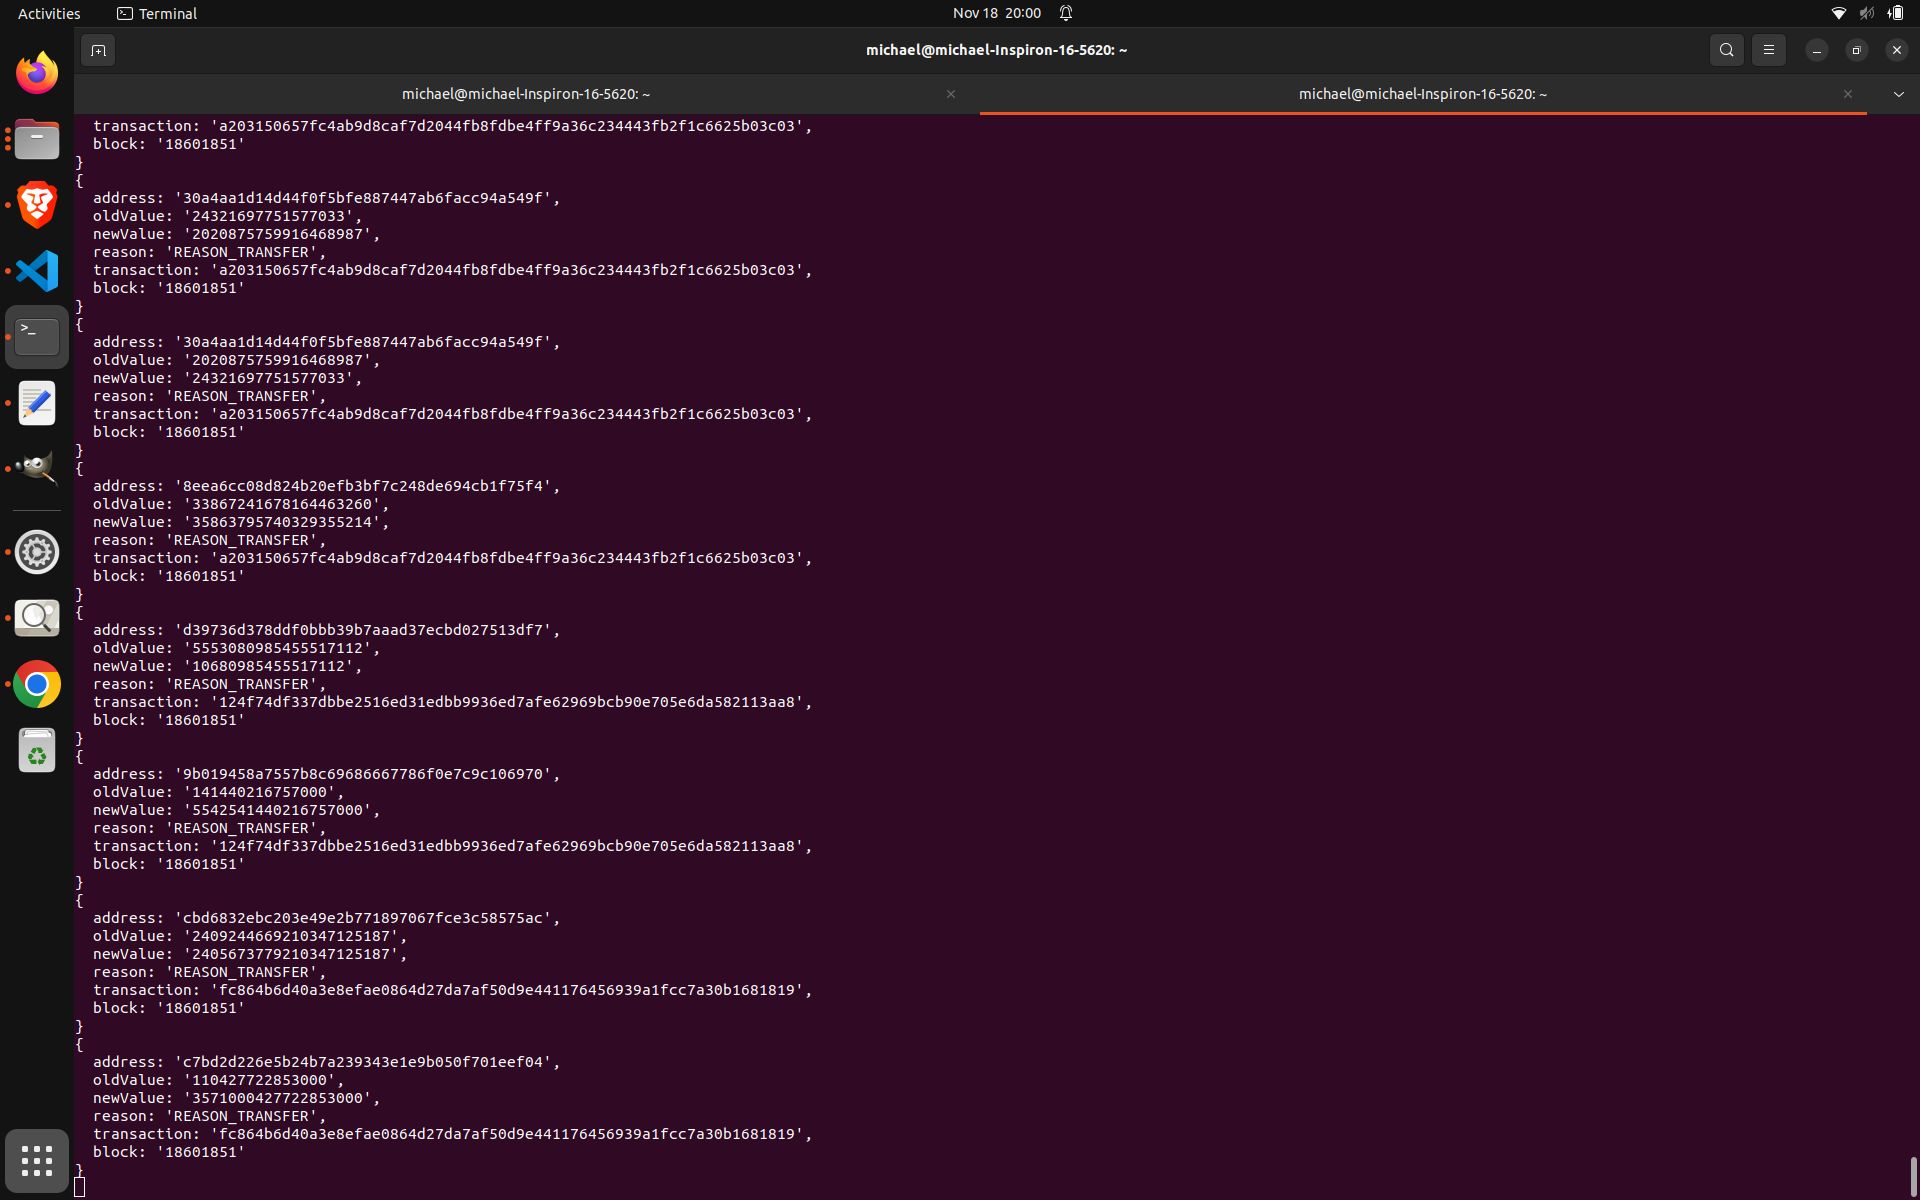
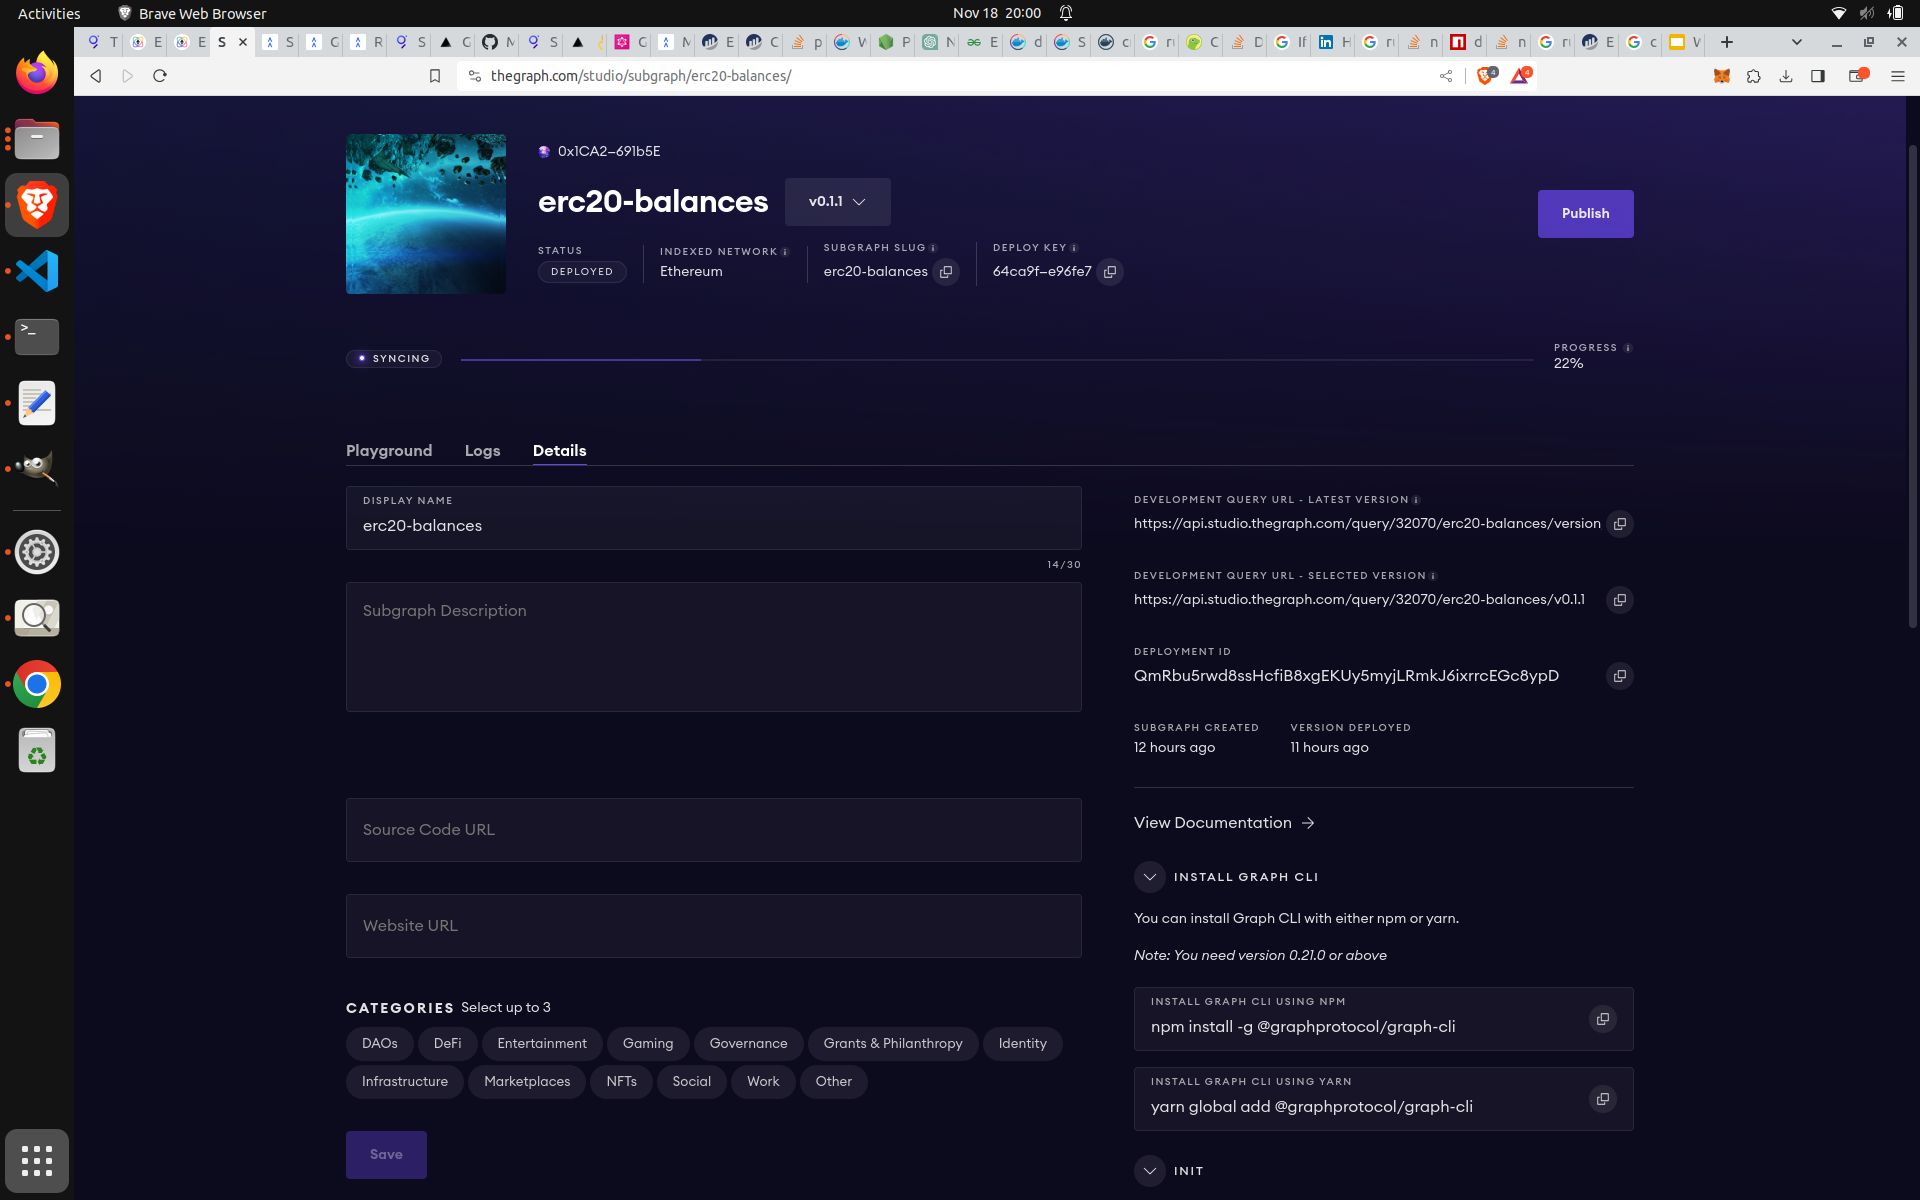
For the userAnalysis service, I deployed the "ERC20-Balance-Changes" Substream built by Streamingfast as a subgraph, making every single ERC20 transfer a queryable entity for analysis.
Subgraph URI: https://api.studio.thegraph.com/query/32070/erc20-balances/version/latest Deployment ID: QmRbu5rwd8ssHcfiB8xgEKUy5myjLRmkJ6ixrrcEGc8ypD
Tool Types
There are 2 main categories of tools; Streams and Reads
Streams
Streams are powered by Streamingfast Substreams in order to get live transaction data as soon as it is mined. Access block data faster than the Etherscan API. This category is ideal for building monitor services and bots, as the built in tools provided by DataDock allow you to parse every single transaction on every block as it is mined. With customized triggersand logic, you can scan for events and act accordingly with behavior such as internal server calls, external API requests, socket emissions, and Ethereum transaction signing.
Reads
Reads use subgraph data in order to analyze indexed, historical blockchain data. With the Messari standardized subgraphs, you can easily compare metrics like yields, volatility, individual positions, counts, cumulative values, etc between different DeFi protocols. This data is incredibly granular, showing every possible statistic on every single transaction/user in the protocol. See subgraphs.xyz for a list of all available DeFi Subgraphs compatible with DataDock.
For even more specificity, you can use the "ERC20-balances" subgraph deployed by DataDock that provides data points for every single ERC20 transfer that has occured on Ethereum Mainnet (deployed from Streamingfast's spkg). Combining data from every ERC20 transfer with custom scoring logic, you can analyze an address for any metric or trait you want. Since this subgraph was deployed on 18/11, it may not be synced up to chain head by the time that you are reading this.