gho dashboard
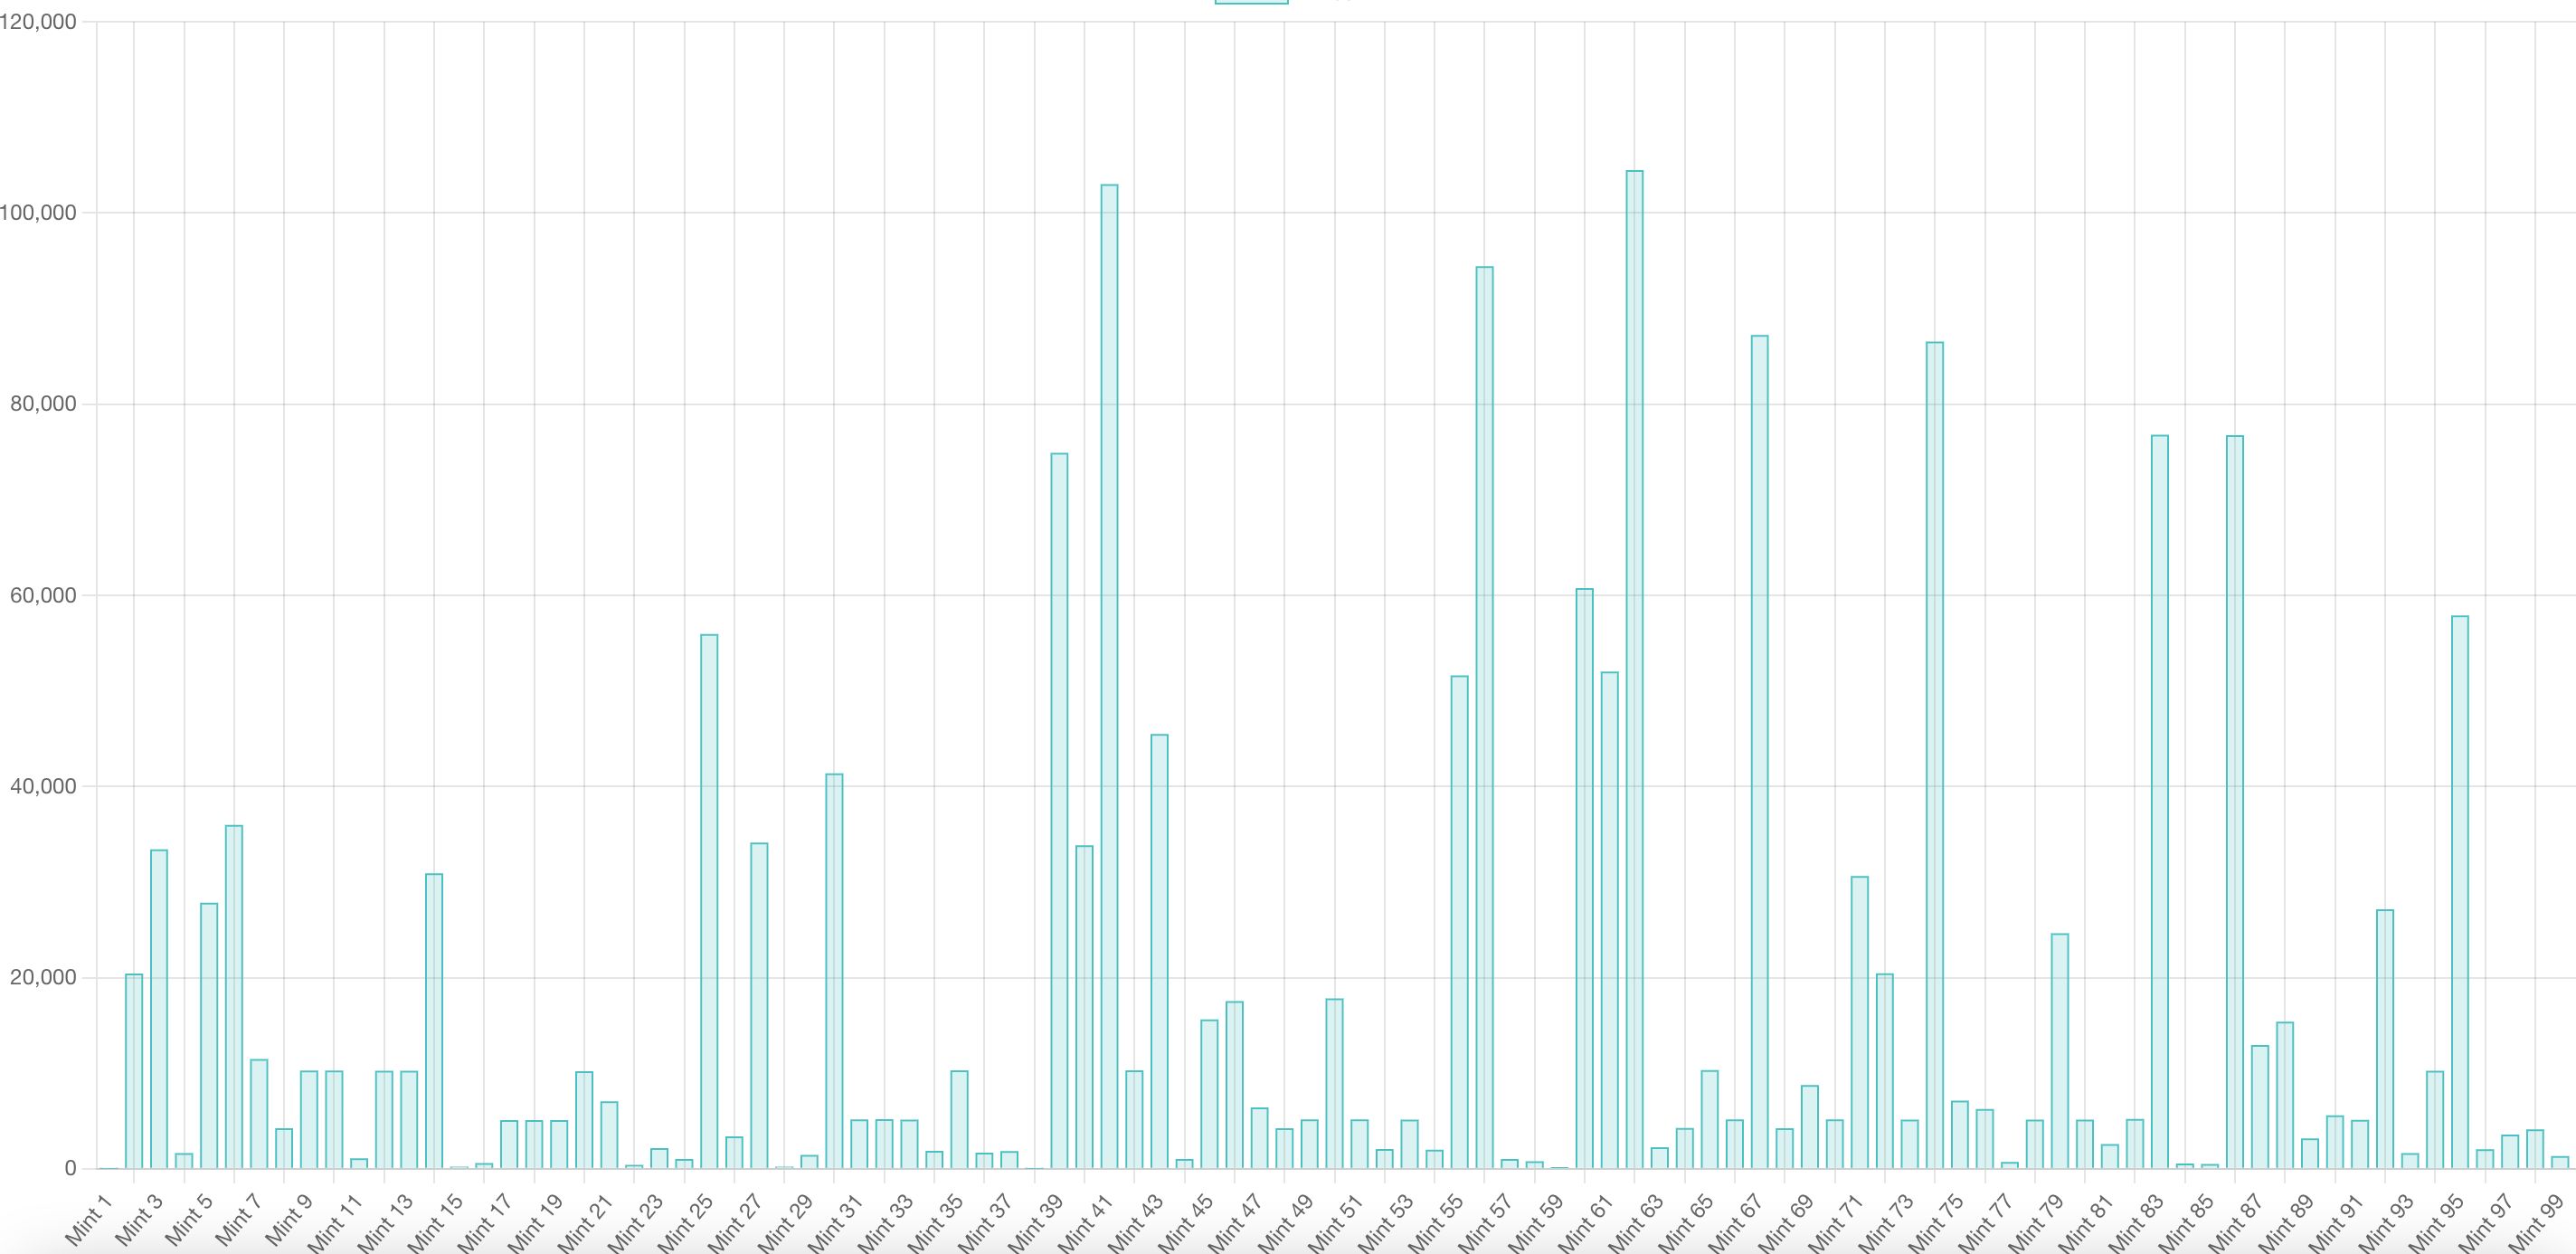
A dashboard showing certain metrics like gho minting amount over time.
Project Description
This is a simple dashboard that shows whenever a facilitator mints gho. I will continue adding more stuff into it. It is important to see various metrics visually so that the whole picture is clearer in mind. This is why I decided to create a dashboard. In future more metrics such as fees, discount, liquidation, price history can also be shown.
How it's Made
It is made with react. It uses the graphql api (https://thegraph.com/hosted-service/subgraph/aave/gho-mainnet) and chart.js It is a webapp which I will probably host somewhere. Currently I am just running it locally. React makes it easier to bootstrap and create nice looking visualisation.