JEM-4000
Visualize StarkNet transactions and top tokens in real-time using a 3D globe interface with data from Voyager API.
Project Description
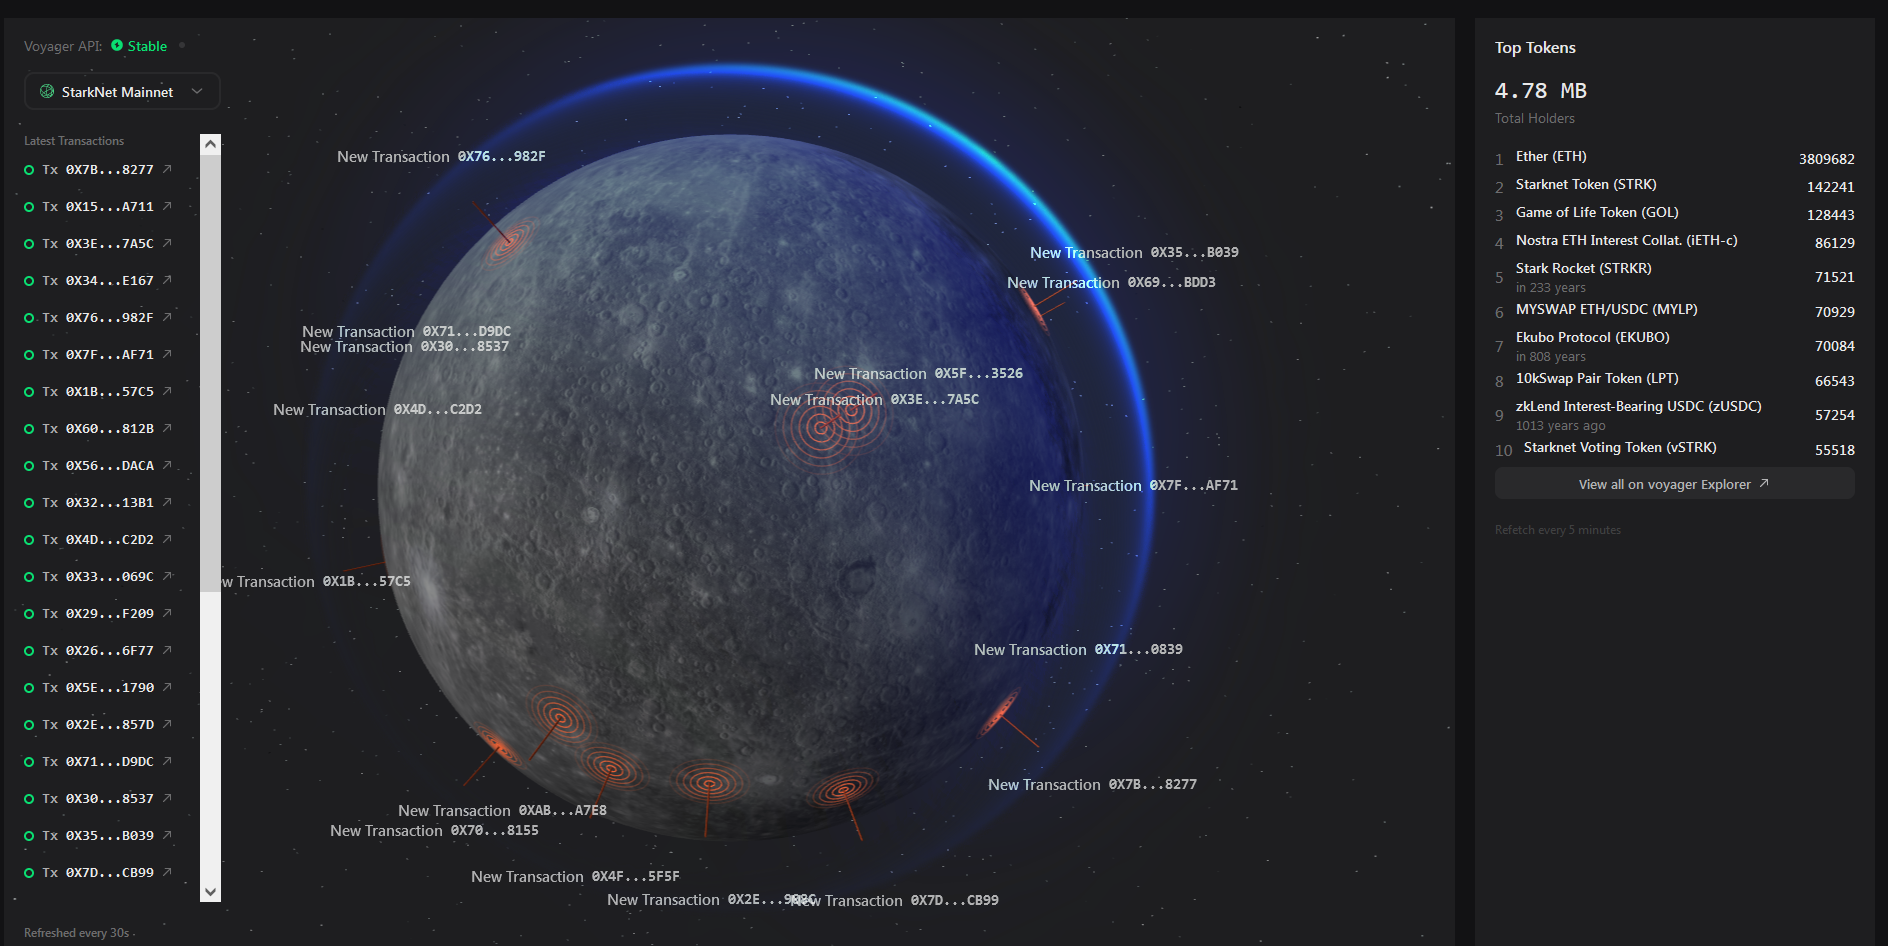
JEM4000 is a dynamic dashboard that visualizes StarkNet blockchain transactions and displays the top tokens in real-time. Using Voyager API, the data is rendered onto a 3D globe, providing an interactive and visually engaging way to monitor blockchain activity. The dashboard also lists the top tokens, giving users a comprehensive view of the StarkNet ecosystem. The goal is to create an intuitive and immersive experience for users to track blockchain transactions and token statistics.
How it's Made
JEM-4000 transforms complex blockchain data into an accessible and interactive experience through an innovative combination of technologies:
-
Real-Time Data Fetching:
- The Voyager API continuously supplies live transaction data and token statistics from the StarkNet blockchain. This real-time data feed ensures the dashboard reflects the most current blockchain activities.
-
Data Processing:
- Once the data is fetched, it undergoes customized parsing to handle the large volumes efficiently. This ensures that the application remains responsive and performant, even under heavy data loads.
-
3D Visualization:
- The core of the visual experience is built with Three.js and its extension, three-globe. These libraries render a fully interactive 3D globe where each transaction is mapped visually. The globe allows users to explore transactions spatially, providing a global perspective on StarkNet activity.
-
Interactive UI:
- Vue 3 powers the user interface, offering a reactive and composable component structure that ensures smooth interactions. Pinia manages the state of the application, making sure that data flows seamlessly between components without unnecessary re-renders.
-
Dynamic Data Transformation:
- D3.js is used for intricate data visualizations, transforming raw data into meaningful visual formats. This includes charts and graphs that depict token statistics and transaction trends.
-
User Interaction:
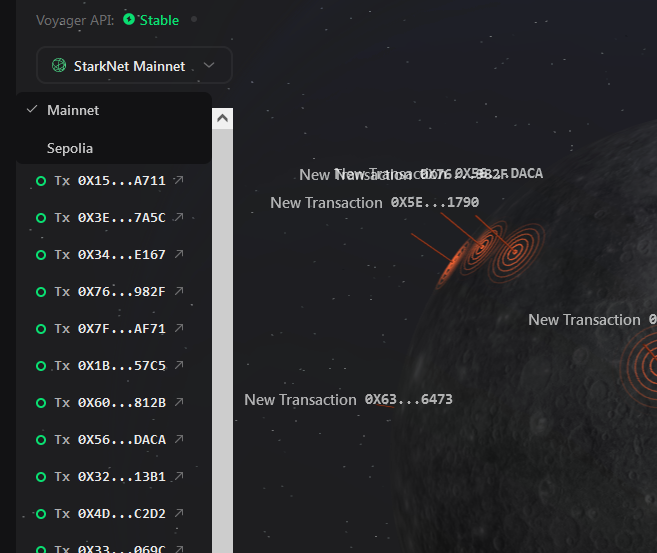
- The interactive globe and data visualizations are not just for display; they are fully interactive. Users can click on different regions of the globe to drill down into transaction details, or hover over tokens to see real-time statistics.
-
Elegant Styling:
- The application's styling is crafted with Sass, allowing for a flexible and maintainable CSS architecture. This ensures that the interface is not only functional but also visually appealing.
-
Robust Navigation:
- Vue Router manages the navigation between different views and components within the application. This provides a smooth and intuitive user experience, allowing users to easily switch between viewing transaction data and token statistics.
-
Reliable Time Management:
- Luxon handles all date and time formatting, ensuring that timestamps are accurate and presented in a user-friendly manner.
-
Unique Data Identification:
- To maintain data integrity and consistency, uuid is used to generate unique identifiers for each transaction and token entry.
Through this sophisticated blend of technologies, the StarkNet Transaction Visualizer offers users an engaging and informative way to monitor blockchain activities, making complex data comprehensible and visually compelling.