TornadoTrack
Dashboard for viewing Tornado Cash mixer usage on all chains, using Envio.
TornadoTrack
Created At
Winner of
Envio - Best Runner-Up for Use of HyperIndex or HyperSync
Project Description
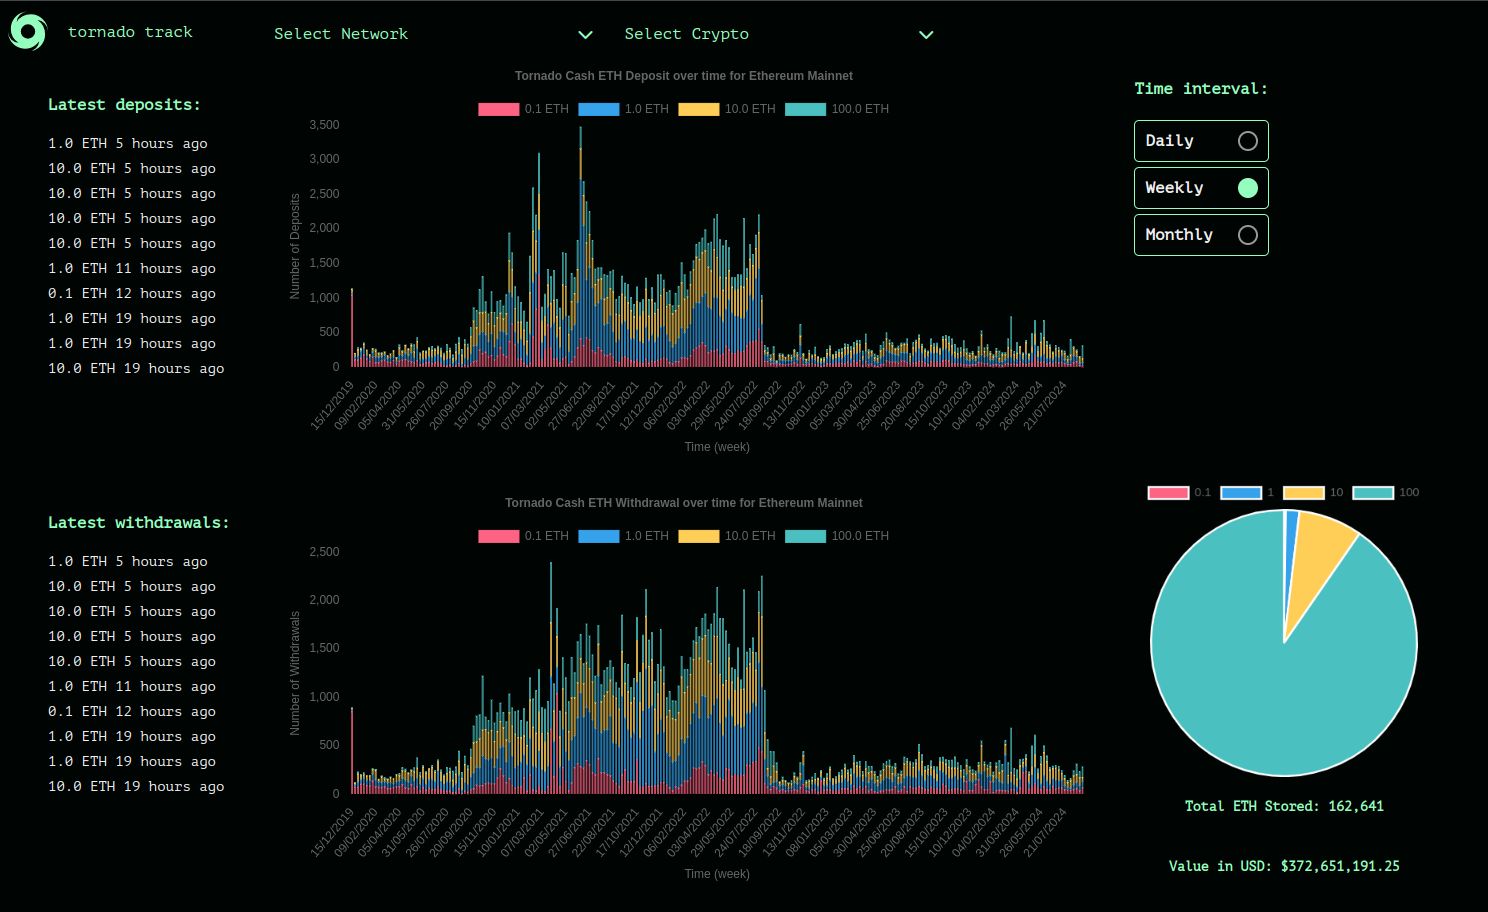
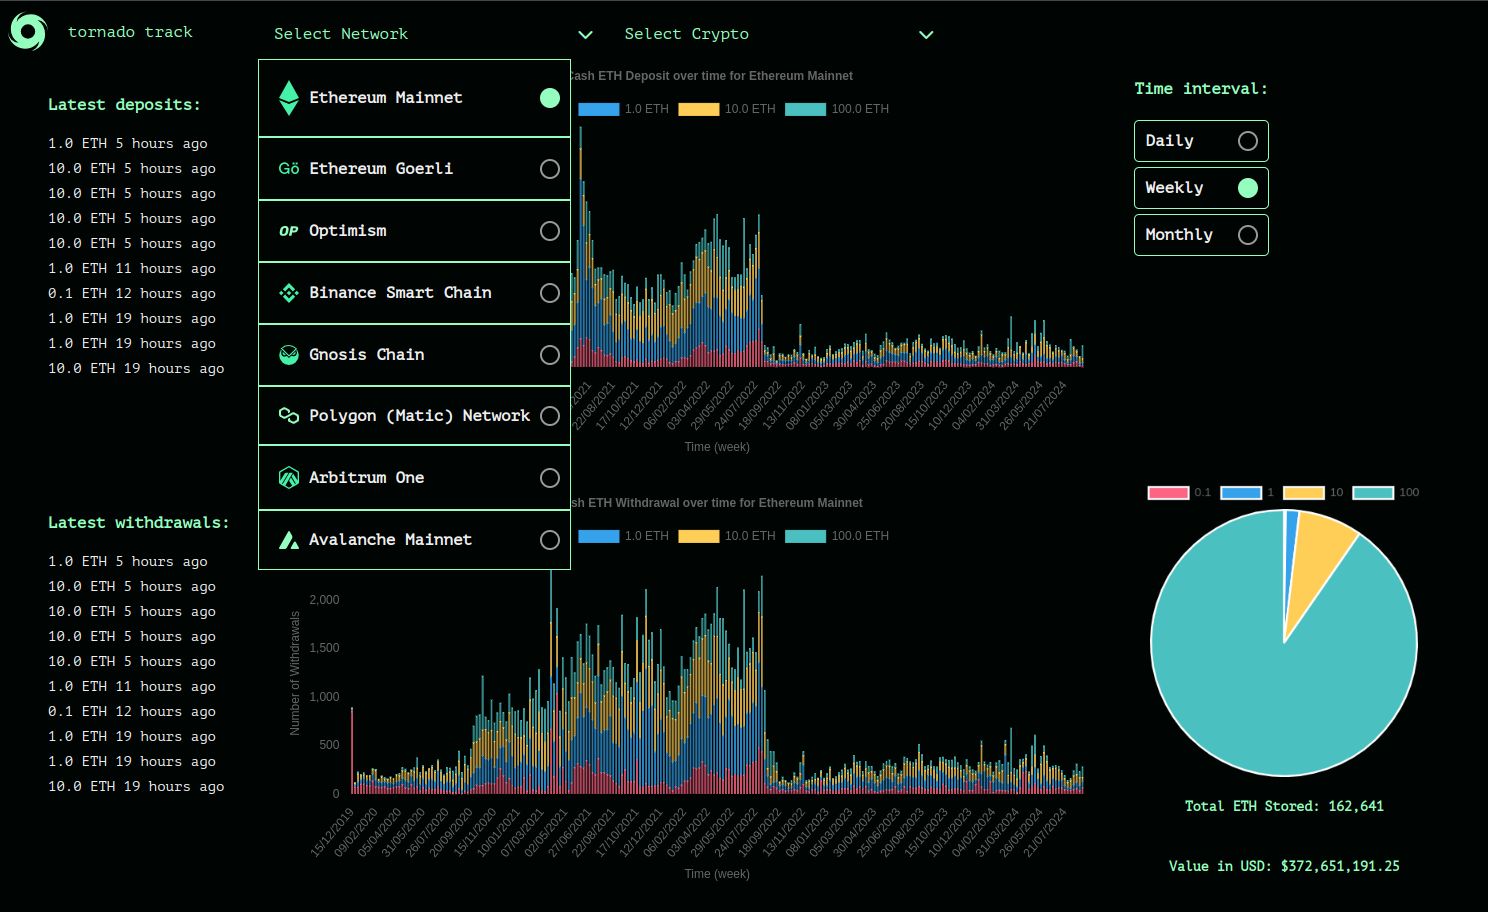
This project focuses on building a dashboard that tracks Tornado Cash transactions over time, offering a clear view of both deposits and withdrawals. It will highlight transaction trends and patterns, display the latest activities, and show the live balance held in each Tornado Cash contract. Users will be able to view the data by day, week, or month. The dashboard will also aggregate data from multiple blockchain networks and support all cryptocurrencies, providing a comprehensive overview of Tornado Cash's usage across the crypto space. The aim is to create a robust tool for real-time analysis of Tornado Cash activity.
How it's Made
The goal of TornadoTrack is to monitor deposits, withdrawals, and the live amount stored in each Tornado Cash contract.
Tech Stack:
-
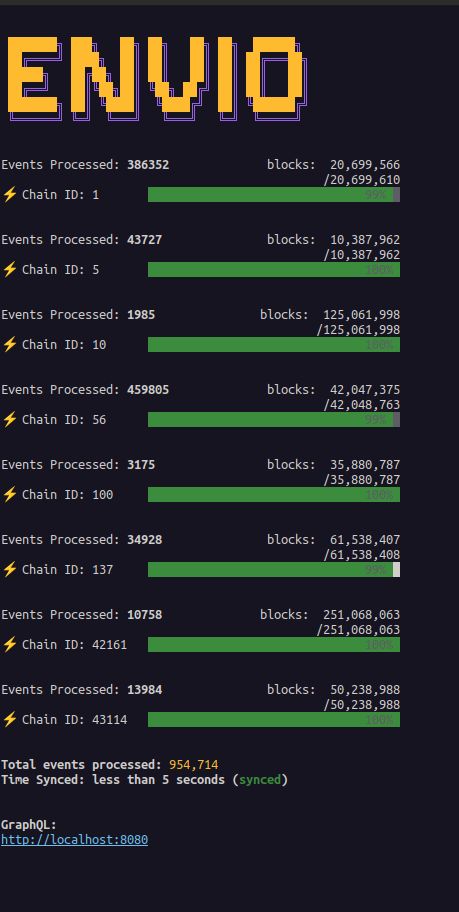
Envio HyperIndex: I am self hosting an Envio HyperIndex instance. This tool is used to retrieve and index historical data across all blockchain networks. It ensures that the dashboard displays an accurate and up to date history of transactions for all relevant cryptocurrencies.
-
Backend: I am running a Django server to host and serve the web pages. Django was chosen for its robustness and ease of integration with other components of the tech stack (plus I like python:) )
-
Frontend: The frontend is built using Jinjas templating engine, which works very well with Django to render dynamic content on the web pages and vanilla Javascript / CSS - I don't like frameworks much. I am also using the charts.js library to show graphs and the pie chart.
How stuff connects: When a user goes to the website, a request is sent to my django server indicating which chain and currency the user wants to have info for. The backend server in turns either retrieves the cached data (using a docker redis instance) or sends a graphql request to my hyperindex instance for the deposit / withdrawal data. At the same time, several request are sent to etherscan to get the amount currently stored in the Tornado Cash instance contracts. Once all the data has been fetched, the page is rendered. The page consists of:
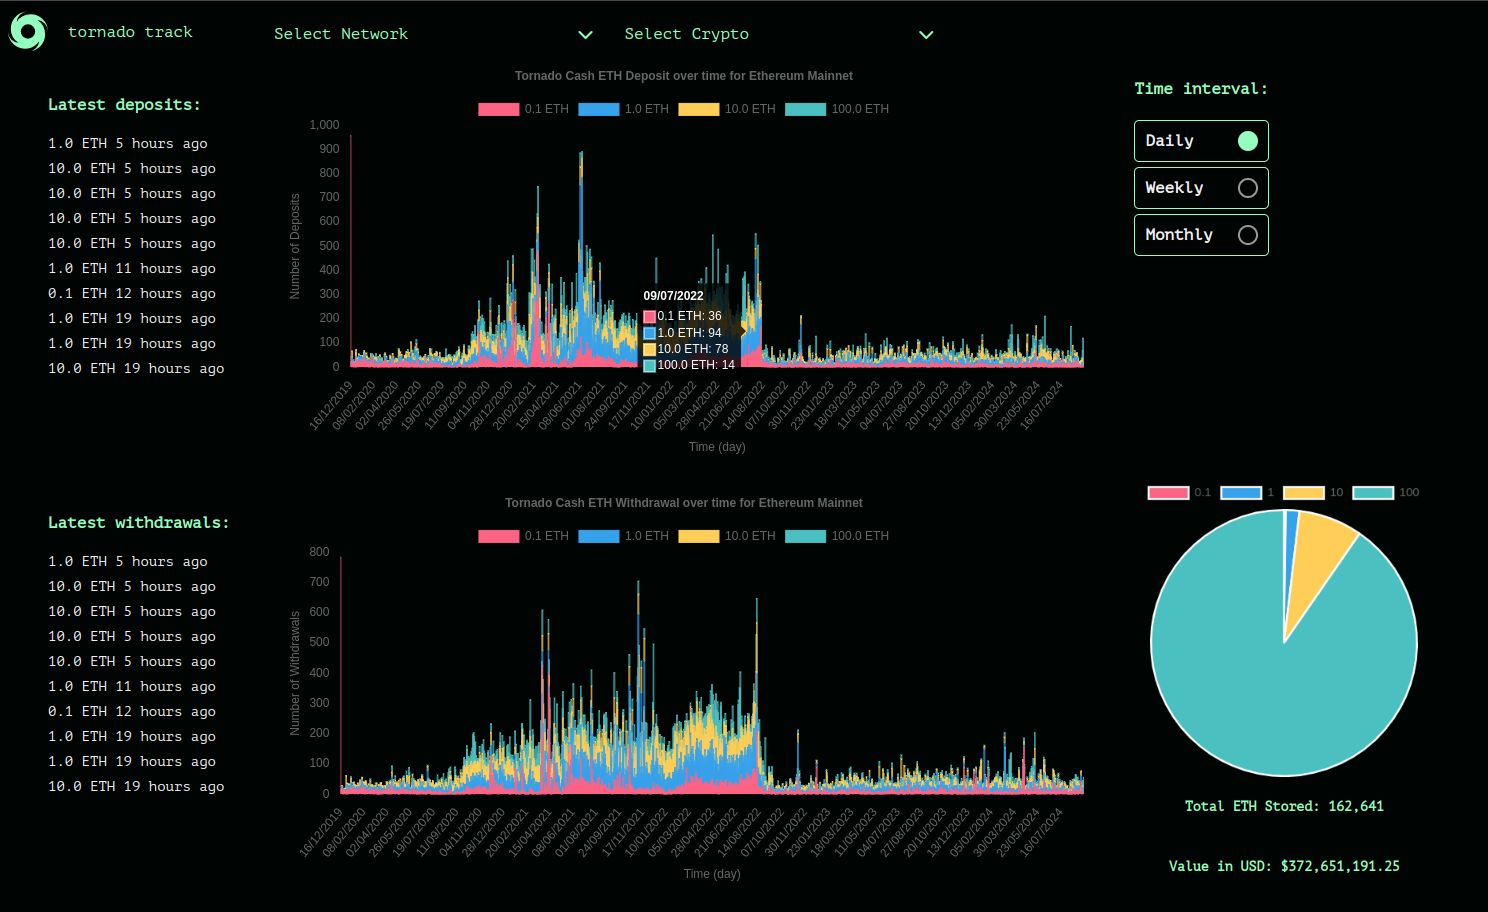
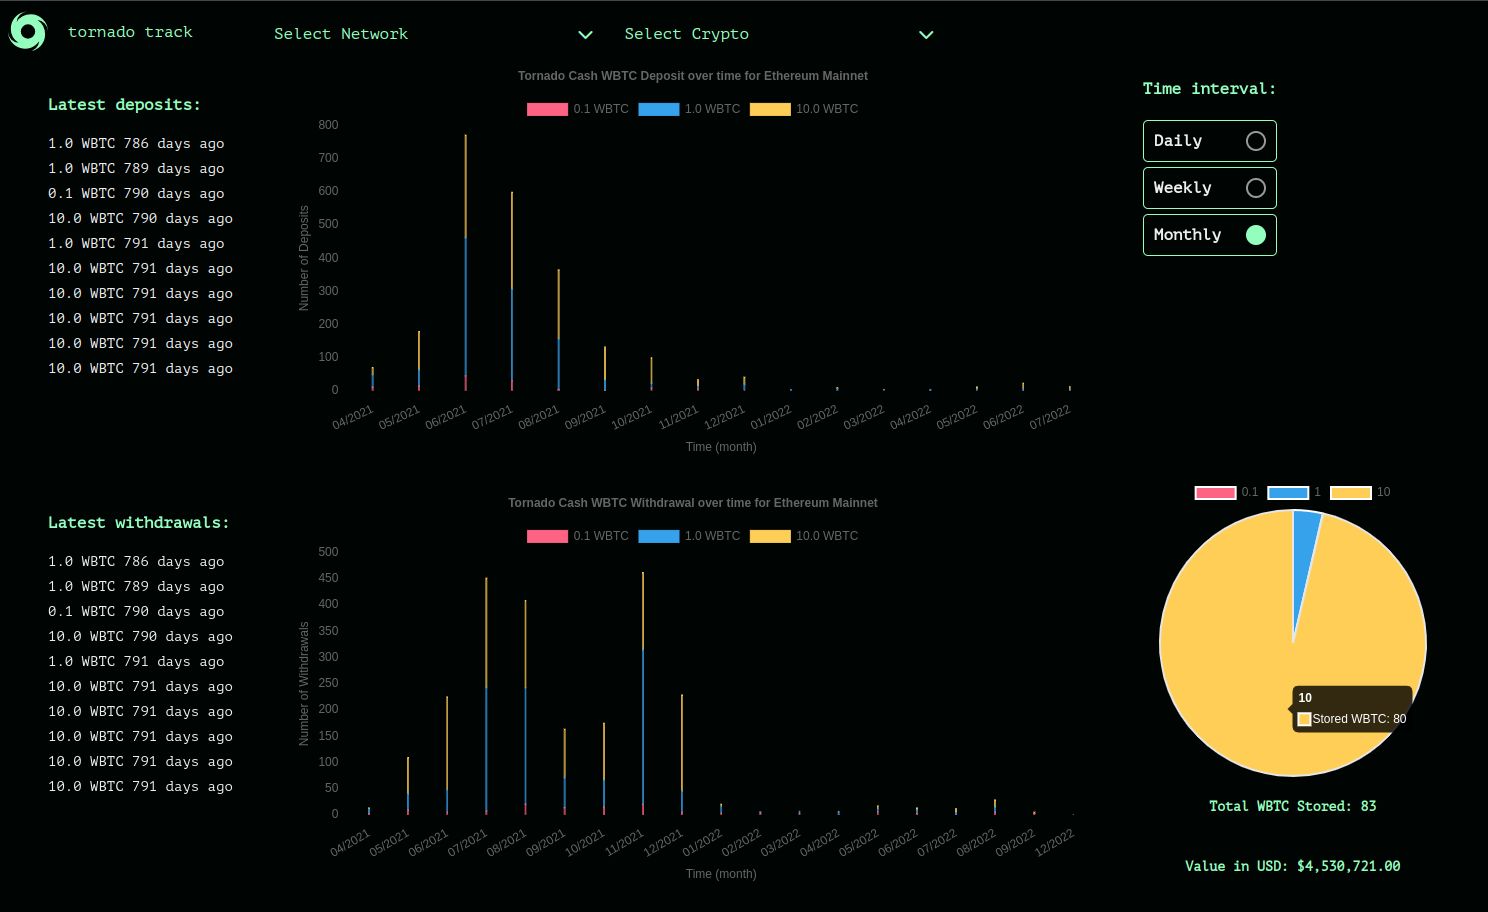
- 2 graphs showing withdrawals and deposits, aggregating for all deposit amounts
- 2 tabs showing the latest transactions on the given network / crypto pair
- a pie chart showing the amount of crypto stored in the given Tornado Cash instance contracts
Navigation is very simple, users can choose to aggregate the data daily, weekly or monthly by selecting from a menu. Similarly, users can choose network and crypto from a menu in the navbar.
Users can interact with the graph and pie chart by clicking on the labels to show or hide certain amounts.